




What Is Imaging Exchange Analytics, and Why Does It Matter for Your Budget?
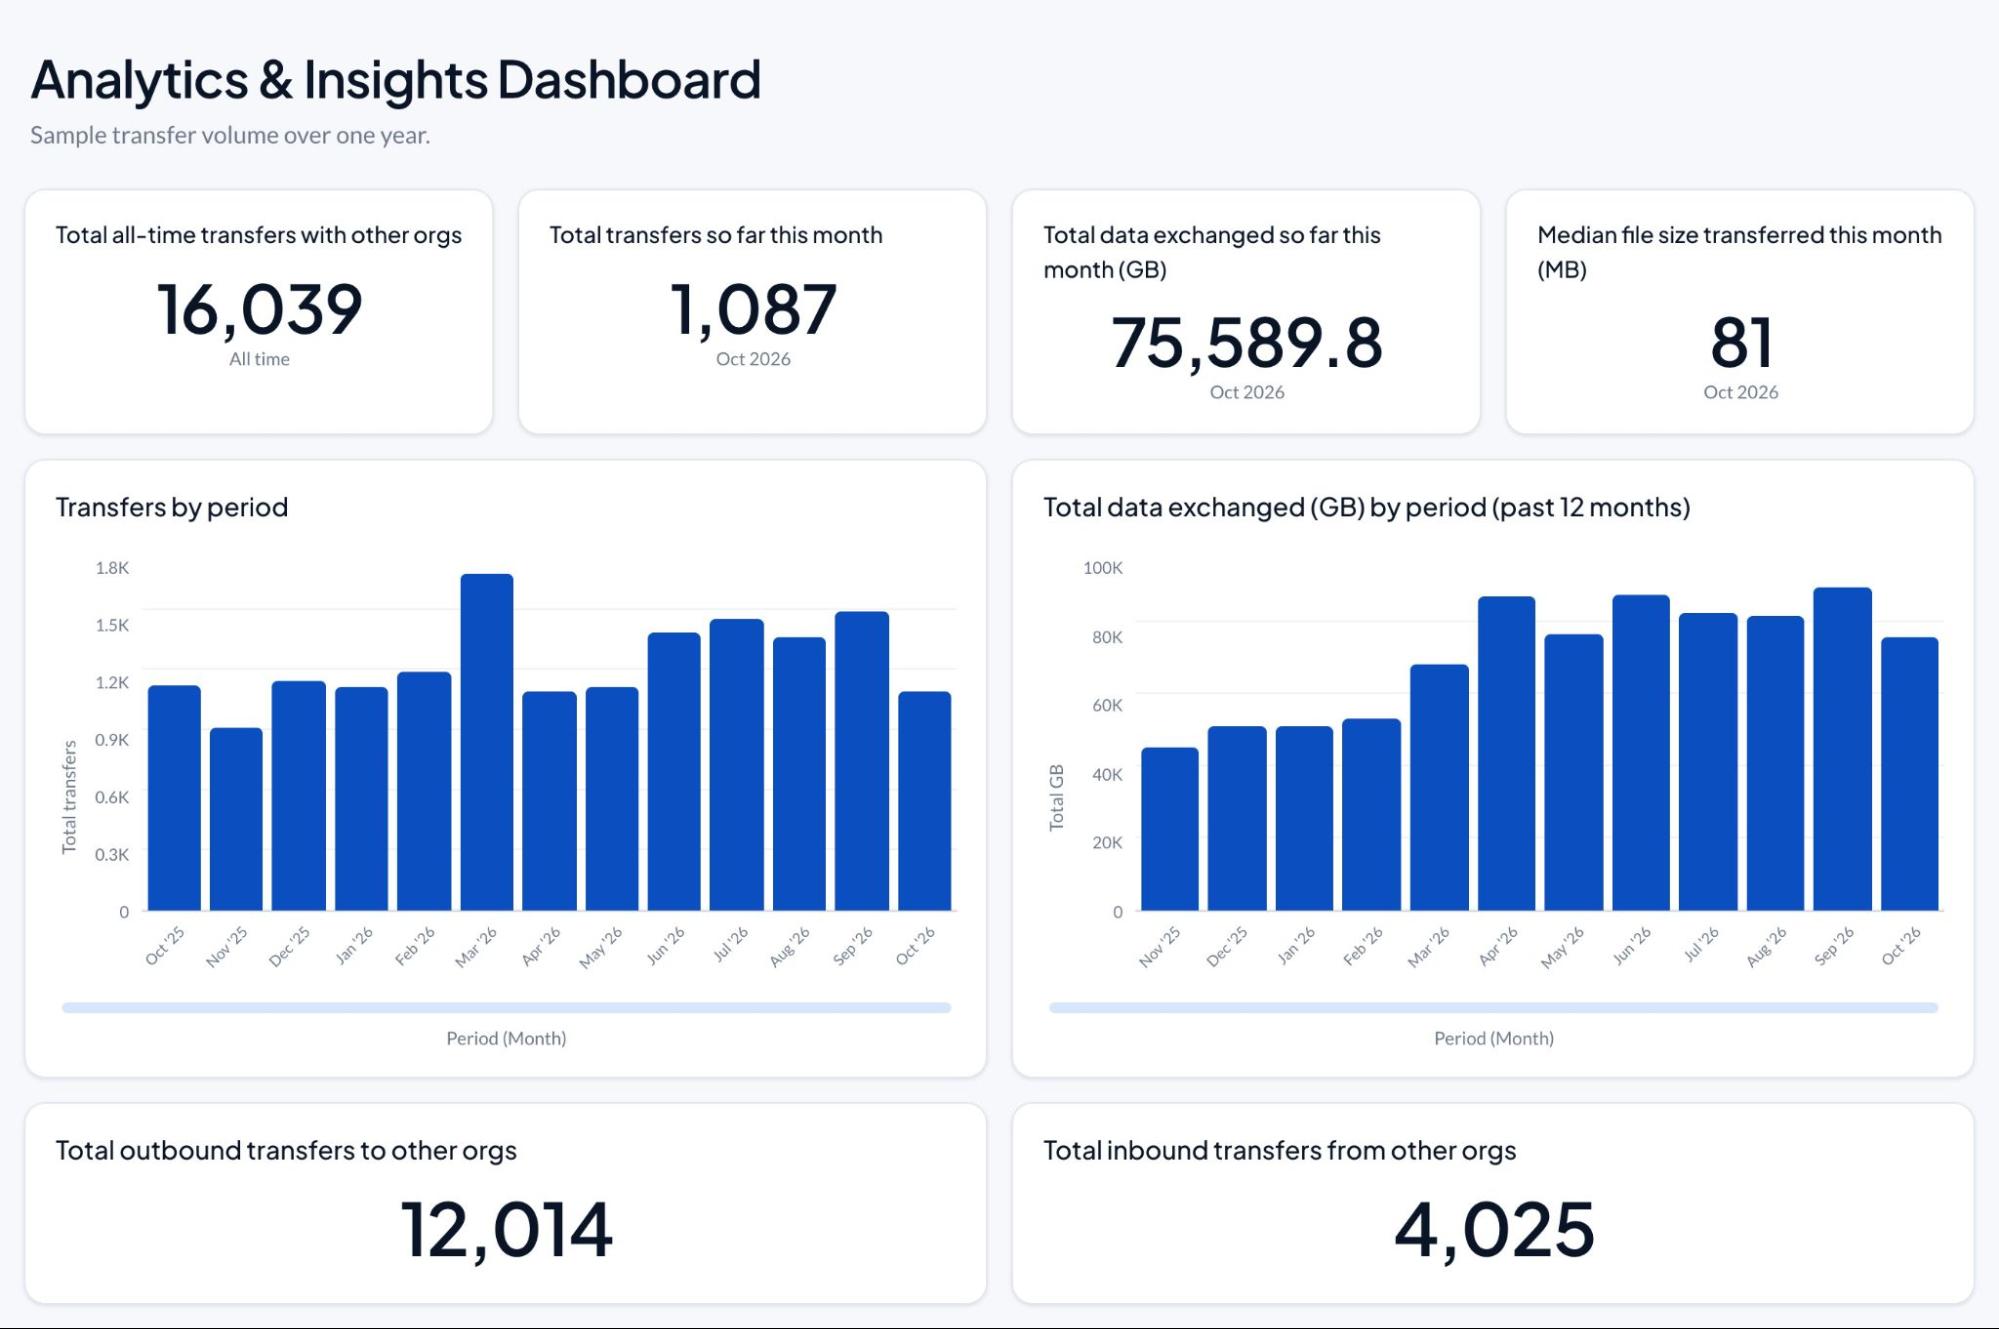
Imaging exchange analytics shows how many studies move in and out of your organization, which partners send them and how your imaging systems are performing. Medicom’s Analytics & Insights gives imaging leaders, exchange managers and IT self-service dashboards for all of it, so budget answers are a click away.
Share


Table of contents
Imaging leadership is preparing a quarterly review and needs outside study volume by month. An exchange manager is deciding which partner connections deserve more attention and which have gone quiet. An IT lead sees a queue building and wants to know whether throughput has been slipping for weeks. For most teams, each answer sits in logs, vendor reports, and someone’s spreadsheet, so the reply starts with “Let me get back to you.”
Medicom’s Analytics & Insights replaces that scramble with self-service dashboards covering volume, partners, IT performance, and patient adoption. Role-based views give each team its own numbers, with nothing to install and no logs to pull. Imaging leaders get budget requests backed by real numbers, IT teams catch slowdowns early and patients benefit when low-adoption sharing tools get fixed sooner.
How Many Outside Studies Does Your Organization Receive, and From Where?
Without one view of every entry point, an imaging team can’t say how many outside studies arrived last quarter or which partners sent them. Imaging moves between organizations constantly. A 2026 study in Academic Radiology reviewed the largest hospital in each U.S. state and found that 72% still routinely use CDs to transfer images. None had stopped using physical media entirely. With so many entry points, it's tough to keep count of what's coming in and where it's from.
How Much Staff Time Goes Into Manual Imaging Reports?
Every report pulled by hand takes staff time away from patients, worklists and department projects. Manual reporting lands on teams that are already short-staffed. When staff spends an afternoon pulling numbers for a meeting, that's an afternoon away from patients, worklists, and the projects that keep the department running. Multiply that by every quarterly review, every budget request, and every "quick question" from leadership, and the hours add up fast.
How Can IT Spot Imaging Slowdowns Before a Study Stalls?
IT can catch slowdowns early by watching throughput and queue trends over time. Imaging infrastructure tends to get attention when something goes wrong, but most slowdowns start small and quiet. Throughput dips, a connection gets sluggish, a queue builds. IT teams that watch trends over time can spot those patterns early, before a referring physician calls asking where a study went. Analytics & Insights includes IT performance dashboards, so teams can watch those trends without digging through logs.
Do Patients Actually View Their Imaging?
Patients view their reports more than twice as often as their images, according to a large NYU Langone Health study. A 2024 study from NYU Langone Health reviewed 1,685,239 exams performed between July 2020 and June 2021. Patients viewed 54.1% of the reports and only 25.5% of the exam images. A gap like that can sit unnoticed without a view into your own numbers. If you can see that adoption is low at one location or for one tool, you know where to focus outreach and training.
Which Imaging Exchange Metrics Should You Track?
Imaging teams should track five things: transfer and study volumes, partner exchange activity, outside imaging sources, infrastructure health and patient engagement. Getting a clear view doesn't have to mean launching a new reporting project. The most useful setup answers routine questions on demand, so no one has to file a ticket or wait on a vendor. At a minimum, look for visibility into:
- Transfer & Study Volumes: Inbound and outbound exchange volume tracked over time. Imaging leadership needs this number for quarterly reviews.
- Partner Exchange Activity: Which organizations you exchange with most, where volume is climbing, and which connections are underused. You can see which relationships deserve more attention and which have gone quiet.
- Outside Imaging Sources: Network-wide Smart Search activity that shows how much external imaging you're bringing in and which organizations it comes from. Knowing the sources shows which partners send the most.
- Infrastructure Health: Throughput and performance for the systems that move your images, so IT can watch trends without digging through logs. IT can catch a slow queue before a referring physician calls.
- Patient Engagement Rates: How patients use the sharing and upload options, so you can tell which tools are working and which need a push. Low use at one location shows where outreach will pay off.
How Do You Get Imaging Exchange Numbers Today, and With Analytics & Insights?
- Outside Study Volume by Month: Today, the answer sits in logs, vendor reports and someone’s spreadsheet. With Analytics & Insights, a self-service volume dashboard has it ready.
- Partner Connections That Have Gone Quiet: Today, the answer sits in vendor reports and spreadsheets. With Analytics & Insights, a partner dashboard shows which connections deserve more attention and which have gone quiet.
- Throughput Over Time: Today, IT often finds out about a slowdown after something breaks. With Analytics & Insights, IT performance dashboards let teams watch trends and spot patterns early.
- Patient Adoption: Without a view into your own numbers, a gap between report views and image views can sit unnoticed. With Analytics & Insights, patient adoption dashboards show where use is low, so you know where to focus outreach and training.
What Do Patients, Providers and the Enterprise Gain From Imaging Analytics?
Imaging analytics helps patients, providers and the enterprise by turning exchange activity into numbers each team can act on. Role-based permissions let leadership, IT, and operations each see the views that fit their work, so every team gets its own numbers without waiting on anyone. Analytics & Insights lives in the Medicom Portal, with nothing to install and no report requests to file.
Here’s what each group gets:
- Providers and IT: IT spots network bottlenecks before studies stall, while clinicians avoid delayed reads caused by missing prior exams.
- Enterprise: Imaging leadership can quantify outside imaging volume, partner activity, and staff impact, which gives budget requests and vendor reviews hard numbers to stand on.
- Patients: When adoption gaps in sharing and upload tools show up early, they get fixed quickly, so patients spend less time tracking down discs and records between appointments.
Imaging exchange happens around the clock. When it's time to show what your network is doing for your organization, the evidence should be a click away. To see what your own numbers could look like, schedule a quick walkthrough.
Frequently Asked Questions
What is imaging exchange analytics?
Imaging exchange analytics tracks the studies moving in and out of your organization, the partners involved and the performance of the systems that carry them. Medicom’s Analytics & Insights puts that in self-service dashboards, so teams get answers without pulling logs.
Which metrics should an imaging team track for outside studies?
Start with transfer and study volumes, partner exchange activity, outside imaging sources, infrastructure health and patient engagement rates. Together they show what comes in, who sends it, how the systems that move it are performing and whether patients use the sharing and upload options.
How can imaging leaders back up a budget request with data?
Bring numbers on outside imaging volume, partner activity and staff impact. Analytics & Insights puts those numbers in role-based views, so leadership can see them without waiting on anyone.
Do I need to install anything to use Analytics & Insights?
No. Analytics & Insights lives in the Medicom Portal, with nothing to install and no report requests to file. Role-based permissions let leadership, IT and operations each see the views that fit their work.
How does Analytics & Insights help with patient adoption of image sharing?
It shows how patients use the sharing and upload options, so you can tell which tools are working and which need a push. A 2024 NYU Langone Health study of 1,685,239 exams found that patients viewed 54.1% of the reports and 25.5% of the exam images, so knowing where adoption lags tells you where to focus outreach and training.
More Answers
Answers
How Do You Get Outside Imaging Into the EHR Without a Manual Order?
Outside imaging can't attach to the EHR without a matching order and accession number, so it often sits unseen in the archive. Medicom's Auto Order Generation reads the study's DICOM metadata and sends an HL7 order or result automatically, so outside studies show up in the chart just like exams performed on site.
Answers
Why Don't Hospitals Describe the Same Imaging Exam the Same Way?
Hospitals name the same exam differently because each organization builds its own procedure catalog. Medicom research found two institutions describe the same exam with even one identical string only 9% of the time. Those mismatches cause missing priors and repeat scans, so the fix is technology that reads clinical meaning instead of matching exact text.
Answers
What Is Imaging Exchange Analytics, and Why Does It Matter for Your Budget?
Imaging exchange analytics shows how many studies move in and out of your organization, which partners send them and how your imaging systems are performing. Medicom’s Analytics & Insights gives imaging leaders, exchange managers and IT self-service dashboards for all of it, so budget answers are a click away.
Your Plan for Enterprise Imaging Interoperability
Talk to one of our experts to plan your interoperability strategy, explore workflows, or get a personalized demo. We’re here to help.
